
Forecasts built on real data
How much electricity a solar panel produces varies across the country. We model your yield for your location and your roof in design software, then track forecast against actual generation on live sites.
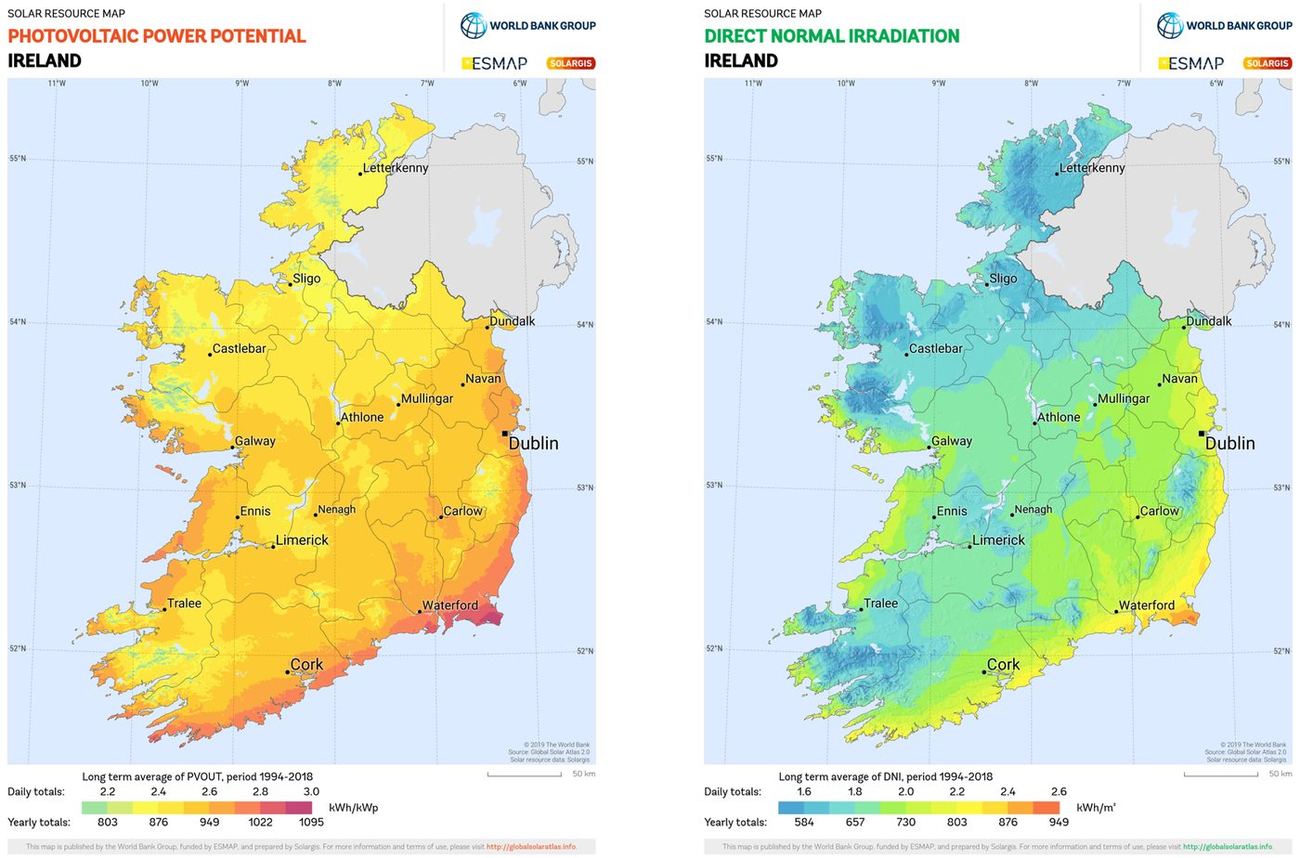
| Wexford | 1,046 | |
|---|---|---|
| Waterford | 988 | |
| Dublin | 981 | |
| Louth | 979 | |
| Cork | 972 | |
| Kilkenny | 955 | |
| Meath | 947 | |
| Laois | 942 | |
| Galway | 941 | |
| Tipperary | 941 | |
| Carlow | 940 | |
| Kildare | 940 | |
| Offaly | 934 | |
| Westmeath | 932 | |
| Clare | 931 | |
| Roscommon | 923 | |
| Wicklow | 917 | |
| Limerick | 916 | |
| Kerry | 909 | |
| Longford | 909 | |
| Monaghan | 895 | |
| Cavan | 889 | |
| Mayo | 879 | |
| Sligo | 868 | |
| Leitrim | 840 | |
| Donegal | 817 |
For an ideally oriented panel, south-facing at 35°. Source: PVGIS 5.3, European Commission Joint Research Centre. One representative location per county, with 14% system losses.
Let's get started
Talk to our team and we'll show you what it means for your premises.